An annual report offers a comprehensive overview of your business’s yearly operations. As the content in these reports is heavy-hitting, it’s essential to present it in a way that helps your audience understand and visualize your successes.
These reports also incorporate various design elements that support your metrics and create a unique, creative, and visually appealing story of your business activities.
In this post, we’ll outline annual report design best-practices, provide a template you can use to create your own, and go over examples of annual reports from other businesses that you can use for inspiration.
What is an annual report?
As a refresher, an annual report is a document created by businesses that display yearly performance, including successes and challenges. It gives a big-picture view of operations and strategies while also going in-depth on key performance metrics.
Annual reports differ from weekly reports in that they address anything and everything that has happened over the past year, including content you’ve already mentioned in weekly, monthly, or any other style of report you’ve made.
Designing an annual report is a careful process, as it is crucial to find a balance between powerful graphics and clarity and understanding. Most reports contain data visualizations, like charts and graphs, to enhance the experience and really call attention to heavy-hitting metrics.
Below we’ll provide a template that you can use to design an annual report for your business and outline the sections that should be included in every report, regardless of industry.
Annual Report Design Template
The template you choose to use to design your annual report should be based on your individual business needs and the metrics you’re hoping to include.
However, you can adapt most templates to fit your business needs, like this template offered by HubSpot. The image below features two pages from the downloadable template, including a company overview and a yearly performance analysis.
The template allows you to go in-depth into aspects of your business that the annual report will discuss, whether it’s marketing campaigns or yearly sales performance. Despite this, there are specific elements that should be included in all annual reports, and we’ll discuss those below.
1. Summarize your yearly goals and strategies.
The first section of your annual report should summarize your yearly goals and strategies. This provides your audience with an overview of your annual focus and gives the information necessary to understand and contextualize the rest of your report.
Essentially, it sets the tone for the rest of the report as it explains the intention behind your operations. If you’re a marketing business creating an annual report, this section could outline your marketing goals and the campaigns you created to reach those goals.
2. Outline key performance indicators (KPIs) and objectives.
Another portion of your annual report should outline the KPIs you used to measure successes. This section is truly the heart of your report, as you’re displaying the results of your year-long activities.
Aim to use charts, graphics, and any other creative design elements, as they will increase the impact of your words and truly demonstrate the importance of your data. For example, say one of your overall goals was to increase ROI across all channels. While you can certainly explain that Twitter ROI has increased 15% YoY, a chart that visually displays the difference between the years paints a clearer picture of success.
A strong annual report is a well-rounded annual report, so this section can also include an analysis of challenges and expected outcomes, where you explain areas that you may have fallen short in terms of achieving your goals.
3. Explain key takeaways and make future recommendations.
While the section above will go into specific detail, it will also be helpful to include an overarching summary of the most important elements of your year. You can take this time to focus on the metrics and campaigns that you think are most important for your stakeholders and audience to know.
You should also aim to make recommendations for future business activities based on your findings from the current year, which can be valuable in terms of getting buy-in from stakeholders and the teams you’re hoping to work with in the future.
Below we’ll discuss best practices for designing a visually appealing and informative annual report that contains all of the information mentioned above.
Annual Report Design Best-Practices
Clear and deliberate design will help you create a visually appealing report that captures attention. Let’s go over the best practices for designing your annual report.
Incorporate branding.
As your report is specific to your business, incorporate branding that lets viewers know that it is specifically for your business.
Branding also aids in recognizability and lets viewers know that you’re owning the successes, challenges, and overall metrics explained in the report.
Use powerful visuals.
As mentioned before, a high-quality report incorporates visuals that aid in the understanding of your metrics. Take special consideration to create visuals for the most significant, heavy-hitting content, like yearly revenue.
Leverage color and fonts.
Another way to ensure that your report captures attention and leaves a lasting impression is by using colors and fonts to call attention to important information. The distinction between a regular metric and a great metric called out in color can go far in making a dent in your audience’s memory.
However, it’s essential to find a balance between design and content.
Don’t be too busy.
Although you can (and should) incorporate various design elements into your annual report, be mindful of standard design principles, and don’t overload your report with unnecessary colors and graphics that will distract from and out shadow the metrics you’re outlining.
A report that is busy, crowded, and filled with different fonts and colors will be harder to understand and won’t leave the impact you want it to leave. Make careful decisions and ensure that your choices are centered around showcasing successes, not simply making the report look pretty.
Annual Report Examples
Let’s look at some examples of high-quality annual reports that you can draw on for inspiration.
Google Annual Diversity Report
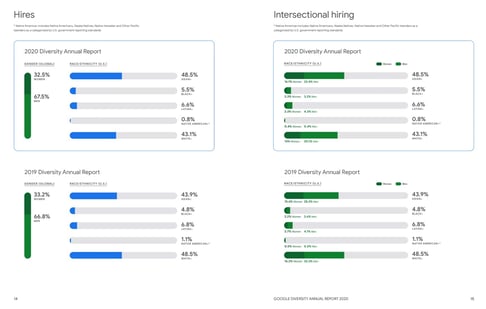
Google’s 2020 Annual Diversity Report is a high-quality report.
The report begins with a high-level overview of Google’s efforts to increase inclusion at the company, diversity goals, and visuals that prove the outcomes of their efforts and show that they’re committed to the task. The image below is a visual depiction of their diversity hiring efforts YoY.
Ablynx
Ablynx is a pharmaceutical company that took a unique, creative approach to an annual report through 3D charts. The image below is an example of the charts they used to create visual representations of where the largest number of business shareholders are located to display their business’ market growth.
Duni
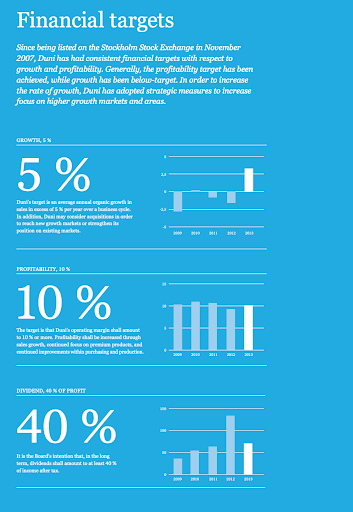
Duni specializes in table-setting and takeaway packaging for restaurants and global businesses. Its annual report is straightforward, clearly organized, and minimalist but still uses color, images, and various design elements to strengthen its words’ impact.
The image below displays their YoY financial target growth that draws in audience attention with large fonts, colors, and line graph visualizations.
Annual Reports Paint a Picture of Success
It’s essential to understand how to create an annual report that displays your business’s successes and incorporates design elements that emphasize your words’ significance and allow your audience to understand, visualize, and absorb your accomplishments.
from Irvine Business Signs https://ift.tt/3cXGWiI
via Irvine Sign Company
![→ Free Download: 4 PowerPoint Presentation Templates [Access Now]](https://no-cache.hubspot.com/cta/default/53/2d0b5298-2daa-4812-b2d4-fa65cd354a8e.png)


